


Dashboard Pro for Google Analytics app for iPhone and iPad
Developer: Velyoo
First release : 03 Apr 2014
App size: 6.62 Mb
Have your Google Analytics key performance indicators always with you on your iPhone or iPad – all at one glance!
Using your Google Analytics account this app shows your website’s metrics and conversions on one single dashboard. Dip into your website’s performance from a management point of view – any time and in real-time. The dashboard metrics will indicate in red or green whether or not you’re on track reaching your website goals, right now or all through the month.
These are the benefits you can profit from when using Dashboard Pro for Google Analytics:
► Real-time dashboard for Google Analytics
- Have your most important Google Analytics KPIs always at your fingertips
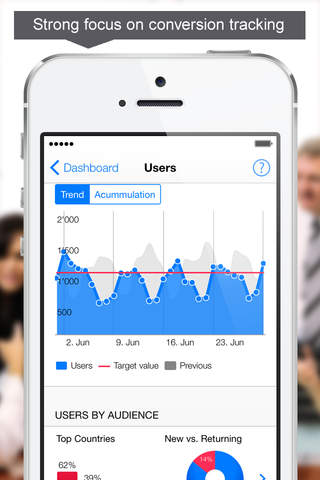
- Watch your visitors live and in real-time on an auto-updating chart
► Individual goals and target values
- Define target values for each Google Analytics KPI (e.g. 1000 visitors per day)
- See how youre on track reaching your target for right now, today, this week and this month
- Compare easily to previous periods
- Get a quick indication in red, white or green for how well you are doing
► Website performance index
- Monitor your overall website performance in one single number (the Website Performance Index) as if it was a stock index like NASDAQ or Dow Jones
- On this weight each of your KPIs regarding its importance compared to the other ones (e.g. a conversion shall be 50 times more important than a visit)
- Let the application then calculate the performance index automatically and in real-time
► Drilldowns to more than 90 Google Analytics reports
- Get the right details for answering your potential questions (e.g. knowing which country most converting visitors are coming from is just a matter of seconds)
- Drill down to more than 90 Google Analytics reports, including countries, language, city, new vs. returning, browser, operating system, custom variables, referrals, campaigs, search keywords, adWords, social, content pages, site search, events, and much more
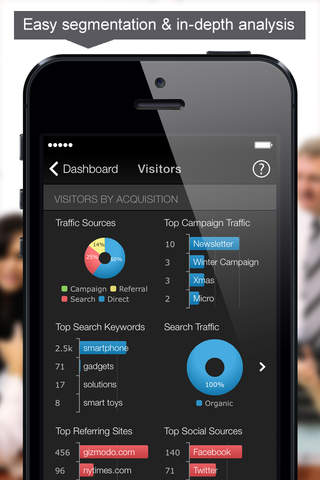
► Pre-segmented charts
- Use segmentation as easy as it can be by just tapping a metric on the dashboard
- Let the app automatically segment all reports by the selected KPI
- E.g. finding the campaign with the highest ecommerce revenue is just a matter of a few taps then
- Use your built-in and custom segments that are defined in Google Analytics
The following features are included:
- Black and white theme
- Dashboards for each of your Google Analytics profiles (number of accounts and profiles unlimited)
- History chart for each metric in a trended and accumulated view, comparing the values to your targets and to the previous period
- Pre-defined time spans for now, today, this week, this month as well as yesterday, last week and last month
- Built-in and custom segments
- Available metrics: Page views, visits, visitors, total goal conversion, total goal value, all 20 individual Google Analytics goals, goal values, ecommerce transactions and revenue
- Drilldown metrics: Pages/visit, avg. visit duration, % of new visits, bounce rate
- Audience reports like language, countries, city, continent, region, new vs. returning, counts of visit, page depth, operating system, mobile device, custom variables etc.
- Acquisition reports like medium, referrals, landing pages, keywords, campaigns, social networks, AdWords etc.
- Behaviour reports like pages, page title, exit pages, site search usage, events etc.
- Secure login via Google oAuth 2.0
- Access to real-time data, including charts for audience, acquisition and content (beta)
Some of these features are even on top of the Google Analytics functionality and make it very convenient for businessmen or managers to always keep the current website performance in a view.
A free Google Analytics account is required for using this app. Your feedback is very appreciated.